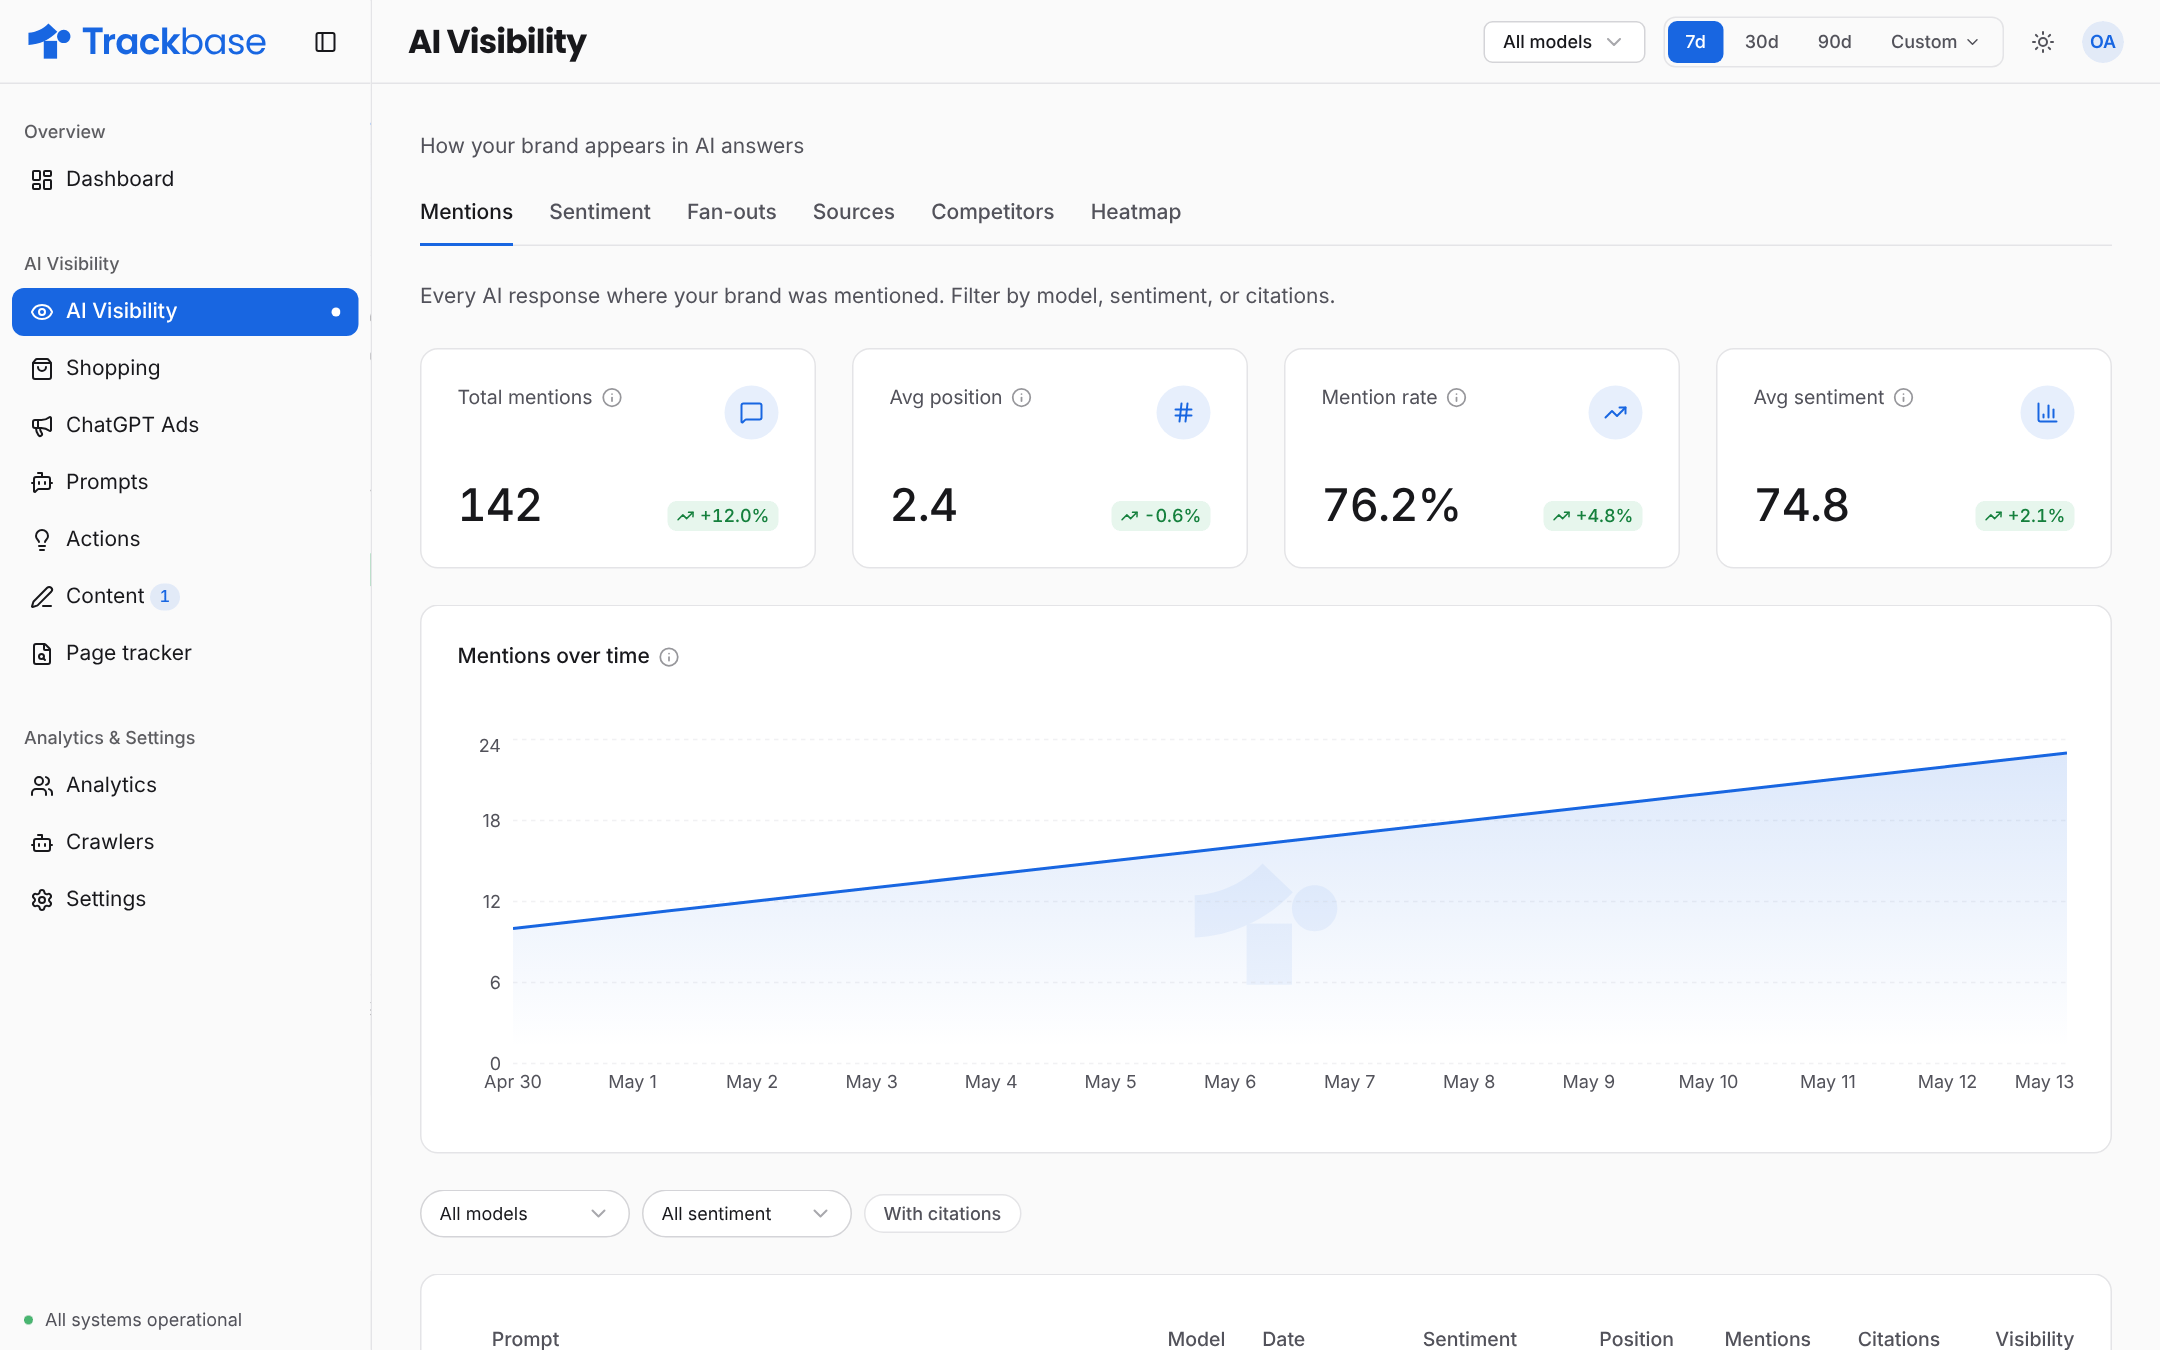
The AI Visibility page shows how your brand appears in AI answers, in six tabs: Mentions, Sentiment, Fan-outs, Sources, Competitors and Heatmap.
The dashboard gives you the headline numbers. The AI Visibility page in Trackbase is where you look behind them: which answers mention you, how they describe you, what the models searched for, which sources they cite, who you compete with and how you score per model.
Every AI answer that mentions your brand, with total mentions, average position, mention rate and average sentiment. Filter by model, sentiment or answers with citations.
How AI answers frame your brand over time: the daily split between positive, neutral and negative, your current sentiment score out of 100, and the sentiment around citations.
The URLs and domains AI models cite, with the number of unique URLs, unique domains and the average number of sources per answer. Switch between a URL, domain and prompt view.
The Heatmap tab puts brands in rows and AI models in columns. Each cell shows a brand’s visibility on that model, and a darker cell means a higher score.Use it to answer two questions at once:
Where am I weak? Read your own row. A pale cell is a model that rarely mentions you.
Who is strong there? Read that column. The darkest cell shows which competitor that model prefers.
Switch between All and Tracked to include or leave out suggested competitors.
A good overall score can hide one model where you are nearly absent. Check the heatmap before you conclude that things are fine.
Last modified on November 12, 2026
{"docsConfig":{"theme":"mint","$schema":"https://mintlify.com/docs.json","name":"Trackbase Academy","description":"Learn how to measure, understand and improve how AI models such as ChatGPT, Gemini and Perplexity mention your brand with Trackbase.","colors":{"primary":"#1866E1","light":"#5B94F0","dark":"#1252B8"},"logo":{"light":"https://mintcdn.com/trackbase/Yn-1fgKFjXMFFVKa/logo/light.svg?fit=max\u0026auto=format\u0026n=Yn-1fgKFjXMFFVKa\u0026q=85\u0026s=2bcd74b61e3e1b5d984edaca4b4073a5","dark":"https://mintcdn.com/trackbase/Yn-1fgKFjXMFFVKa/logo/dark.png?fit=max\u0026auto=format\u0026n=Yn-1fgKFjXMFFVKa\u0026q=85\u0026s=edaee02b78ba7ade1f8a818ec533bf2e","href":"https://trackbase.ai"},"favicon":"https://mintcdn.com/trackbase/Yn-1fgKFjXMFFVKa/favicon.ico?fit=max\u0026auto=format\u0026n=Yn-1fgKFjXMFFVKa\u0026q=85\u0026s=6440200a6349ebe402583a9dc8e44bec","navbar":{"links":[{"href":"https://trackbase.ai","label":"Website"}],"primary":{"type":"button","label":"Dashboard","href":"https://app.trackbase.ai"}},"footer":{"links":[{"header":"Trackbase","items":[{"label":"Website","href":"https://trackbase.ai"},{"label":"Case studies","href":"https://trackbase.ai/nl/case-studies"},{"label":"Dashboard","href":"https://app.trackbase.ai"}]},{"header":"Legal","items":[{"label":"Terms of service","href":"https://trackbase.ai/terms-of-service"},{"label":"Privacy policy","href":"https://trackbase.ai/privacy-policy"}]}]},"search":{"prompt":"Search the academy..."},"fonts":{"family":"Inter"},"icons":{"library":"lucide"},"errors":{"404":{"redirect":true,"title":"Page not found","description":"This page does not exist. Use the search or go back to the overview."}},"contextual":{"options":["copy","view","chatgpt","claude"],"display":"header"},"metadata":{"timestamp":true},"styling":{"latex":false},"navigation":{"pages":[]}},"deployment":{"deploymentMetadataValue":{"subdomain":"trackbase","hasAudioNarration":false,"actualSubdomain":"trackbase","customDomains":["academy.trackbase.ai"],"gitSource":{"type":"github","owner":"kdercksen","repo":"trackbase.ai","deployBranch":"master","contentDirectory":"mintlify","isPrivate":true,"mountPath":"","label":"","_id":"6af5a12a082ad856dc903d4a"},"entitlements":{"AI_CHAT":{"status":"ENABLED"},"WEB_MCP":{"status":"ENABLED"},"NARRATION":{"status":"ENABLED"}},"buildId":"6af5c4261eecdd5072816d63","clientVersion":"0.0.4111","searchFilterCounts":[{"language":"default","tag":"Core metrics","count":6},{"language":"default","tag":"Set up","count":5},{"language":"default","tag":"Getting started","count":5},{"language":"default","tag":"Take action","count":4},{"language":"default","tag":"AI visibility","count":4},{"language":"default","tag":"Crawlers and traffic","count":4},{"language":"default","tag":"Troubleshooting","count":3},{"language":"default","tag":"Integrations","count":1}]},"assistantConfig":{"enableAskAiButton":false,"enableStarterQuestions":false,"enableContextualStarterQuestions":false,"enableAskAiSearchBar":true},"basePath":"","hasChatPermissions":true,"hasWebMcpPermissions":true,"toggles":[{"name":"kill-isr","enabled":true,"variant":{"name":"disabled","enabled":false,"feature_enabled":true},"impressionData":false},{"name":"custom-rbac-roles","enabled":true,"variant":{"name":"disabled","enabled":false,"feature_enabled":true},"impressionData":false},{"name":"agent-mintlify-slack","enabled":true,"variant":{"name":"disabled","enabled":false,"feature_enabled":true},"impressionData":false},{"name":"agent-integrations-settings","enabled":true,"variant":{"name":"disabled","enabled":false,"feature_enabled":true},"impressionData":false},{"name":"rbac-expansion","enabled":true,"variant":{"name":"disabled","enabled":false,"feature_enabled":true},"impressionData":false},{"name":"automations-pr-grouping","enabled":true,"variant":{"name":"disabled","enabled":false,"feature_enabled":true},"impressionData":false},{"name":"custom-prefix","enabled":true,"variant":{"name":"disabled","enabled":false,"feature_enabled":true},"impressionData":false},{"name":"analytics-v7","enabled":true,"variant":{"name":"disabled","enabled":false,"feature_enabled":true},"impressionData":false},{"name":"user-flows-analytics","enabled":true,"variant":{"name":"disabled","enabled":false,"feature_enabled":true},"impressionData":false},{"name":"no-publish-flow","enabled":true,"variant":{"name":"disabled","enabled":false,"feature_enabled":true},"impressionData":false},{"name":"workos-onboarding","enabled":true,"variant":{"name":"disabled","enabled":false,"feature_enabled":true},"impressionData":false},{"name":"llms-txt-v2","enabled":true,"variant":{"name":"disabled","enabled":false,"feature_enabled":true},"impressionData":false},{"name":"snapshot-serving-live","enabled":true,"variant":{"name":"disabled","enabled":false,"feature_enabled":true},"impressionData":false},{"name":"stripTemperatureMiddleware","enabled":true,"variant":{"name":"disabled","enabled":false,"feature_enabled":true},"impressionData":false},{"name":"support-platform-pylon-zendesk","enabled":true,"variant":{"name":"disabled","enabled":false,"feature_enabled":true},"impressionData":false},{"name":"snapshot-serving","enabled":true,"variant":{"name":"disabled","enabled":false,"feature_enabled":true},"impressionData":false},{"name":"instant-rollback","enabled":true,"variant":{"name":"disabled","enabled":false,"feature_enabled":true},"impressionData":false},{"name":"granular-notifications-server","enabled":true,"variant":{"name":"disabled","enabled":false,"feature_enabled":true},"impressionData":false},{"name":"granular-notifications","enabled":true,"variant":{"name":"disabled","enabled":false,"feature_enabled":true},"impressionData":false},{"name":"automations-fable","enabled":true,"variant":{"name":"disabled","enabled":false,"feature_enabled":true},"impressionData":false},{"name":"fixed-ai-action-pricing","enabled":true,"variant":{"name":"disabled","enabled":false,"feature_enabled":true},"impressionData":false},{"name":"automation-resolve-merge-conflict","enabled":true,"variant":{"name":"disabled","enabled":false,"feature_enabled":true},"impressionData":false},{"name":"scoped-publishing","enabled":true,"variant":{"name":"disabled","enabled":false,"feature_enabled":true},"impressionData":false},{"name":"mintql","enabled":true,"variant":{"name":"disabled","enabled":false,"feature_enabled":true},"impressionData":false},{"name":"page-level-analytics","enabled":true,"variant":{"name":"disabled","enabled":false,"feature_enabled":true},"impressionData":false},{"name":"editor-version-history-v2","enabled":true,"variant":{"name":"disabled","enabled":false,"feature_enabled":true},"impressionData":false},{"name":"billing-page-v2","enabled":true,"variant":{"name":"disabled","enabled":false,"feature_enabled":true},"impressionData":false},{"name":"full-page-search","enabled":true,"variant":{"name":"disabled","enabled":false,"feature_enabled":true},"impressionData":false},{"name":"workspace-projects","enabled":true,"variant":{"name":"disabled","enabled":false,"feature_enabled":true},"impressionData":false},{"name":"assistant-v5","enabled":true,"variant":{"name":"disabled","enabled":false,"feature_enabled":true},"impressionData":false},{"name":"fork-pr-previews","enabled":true,"variant":{"name":"disabled","enabled":false,"feature_enabled":true},"impressionData":false},{"name":"revalidation-jwt","enabled":true,"variant":{"name":"disabled","enabled":false,"feature_enabled":true},"impressionData":false},{"name":"workos-sso-scim","enabled":true,"variant":{"name":"disabled","enabled":false,"feature_enabled":true},"impressionData":false},{"name":"hobby-abuse-scan","enabled":true,"variant":{"name":"disabled","enabled":false,"feature_enabled":true},"impressionData":false},{"name":"dashboard-inbox","enabled":true,"variant":{"name":"disabled","enabled":false,"feature_enabled":true},"impressionData":false},{"name":"workos-signup","enabled":true,"variant":{"name":"disabled","enabled":false,"feature_enabled":true},"impressionData":false},{"name":"turbopuffer-dual-write","enabled":true,"variant":{"name":"disabled","enabled":false,"feature_enabled":true},"impressionData":false},{"name":"workos-enabled","enabled":true,"variant":{"name":"disabled","enabled":false,"feature_enabled":true},"impressionData":false},{"name":"approve-review-flow","enabled":true,"variant":{"name":"disabled","enabled":false,"feature_enabled":true},"impressionData":false},{"name":"editor-metadata","enabled":true,"variant":{"name":"disabled","enabled":false,"feature_enabled":true},"impressionData":false},{"name":"sso-setup-deadline-banner","enabled":true,"variant":{"name":"disabled","enabled":false,"feature_enabled":true},"impressionData":false},{"name":"turbopuffer-serve","enabled":true,"variant":{"name":"disabled","enabled":false,"feature_enabled":true},"impressionData":false},{"name":"live-agents","enabled":true,"variant":{"name":"disabled","enabled":false,"feature_enabled":true},"impressionData":false}],"privacy":{"consentBanner":{"enabled":true}},"googleFontsInlined":false},"customCss":[],"page":{"pagePath":"ai-visibility","slug":"/ai-visibility","pageMetadata":{"title":"The AI Visibility page and its six tabs","sidebarTitle":"AI Visibility page","description":"The AI Visibility page shows how your brand appears in AI answers, in six tabs: Mentions, Sentiment, Fan-outs, Sources, Competitors and Heatmap.","keywords":["AI Visibility","mentions","sources","heatmap","sentiment"],"href":"/ai-visibility"},"description":{"compiledSource":"\"use strict\";\nconst {jsx: _jsx} = arguments[0];\nconst {useMDXComponents: _provideComponents} = arguments[0];\nfunction _createMdxContent(props) {\n const _components = {\n p: \"p\",\n ..._provideComponents(),\n ...props.components\n };\n return _jsx(_components.p, {\n children: \"The AI Visibility page shows how your brand appears in AI answers, in six tabs: Mentions, Sentiment, Fan-outs, Sources, Competitors and Heatmap.\"\n });\n}\nfunction MDXContent(props = {}) {\n const {wrapper: MDXLayout} = {\n ..._provideComponents(),\n ...props.components\n };\n return MDXLayout ? _jsx(MDXLayout, {\n ...props,\n children: _jsx(_createMdxContent, {\n ...props\n })\n }) : _createMdxContent(props);\n}\nreturn {\n default: MDXContent\n};\n","frontmatter":{},"scope":{}},"pageType":"default","mdx":{"mdxSource":{"compiledSource":"\"use strict\";const{Fragment:_Fragment,jsx:_jsx,jsxs:_jsxs}=arguments[0];const{useMDXComponents:_provideComponents}=arguments[0];function _createMdxContent(props){const _components={a:`a`,li:`li`,p:`p`,strong:`strong`,tbody:`tbody`,td:`td`,th:`th`,thead:`thead`,tr:`tr`,ul:`ul`,..._provideComponents(),...props.components},{Heading,OptimizedImage,Table,Tip}=_components;if(!Heading)_missingMdxReference(`Heading`,true);if(!OptimizedImage)_missingMdxReference(`OptimizedImage`,true);if(!Table)_missingMdxReference(`Table`,true);if(!Tip)_missingMdxReference(`Tip`,true);return _jsxs(_Fragment,{children:[_jsxs(_components.p,{children:[`The dashboard gives you the headline numbers. The `,_jsx(_components.strong,{children:`AI Visibility`}),` page in Trackbase is where you look behind them: which answers mention you, how they describe you, what the models searched for, which sources they cite, who you compete with and how you score per model.`]}),`\n`,_jsx(OptimizedImage,{src:`https://mintcdn.com/trackbase/3L0jUS0Gnf-g9E7B/images/ai-visibility-mentions.png?fit=max\u0026auto=format\u0026n=3L0jUS0Gnf-g9E7B\u0026q=85\u0026s=6ef58743d31dc67aebb2b783bd1e7038`,alt:`The Mentions tab of the AI Visibility page in Trackbase, with total mentions, average position, mention rate and average sentiment above the mentions over time chart. Example data.`,\"data-og-width\":`2160`,width:`2160`,\"data-og-height\":`1350`,height:`1350`,\"data-path\":`images/ai-visibility-mentions.png`,\"data-optimize\":`true`,\"data-opv\":`3`,srcset:`https://mintcdn.com/trackbase/3L0jUS0Gnf-g9E7B/images/ai-visibility-mentions.png?w=280\u0026fit=max\u0026auto=format\u0026n=3L0jUS0Gnf-g9E7B\u0026q=85\u0026s=57b1b203c80e4d68778e3991f26817c7 280w, https://mintcdn.com/trackbase/3L0jUS0Gnf-g9E7B/images/ai-visibility-mentions.png?w=560\u0026fit=max\u0026auto=format\u0026n=3L0jUS0Gnf-g9E7B\u0026q=85\u0026s=1a252dd5c92aefebf47b11d2980d02b6 560w, https://mintcdn.com/trackbase/3L0jUS0Gnf-g9E7B/images/ai-visibility-mentions.png?w=840\u0026fit=max\u0026auto=format\u0026n=3L0jUS0Gnf-g9E7B\u0026q=85\u0026s=e964fcfcd510d88a06a0a6afa9e7a107 840w, https://mintcdn.com/trackbase/3L0jUS0Gnf-g9E7B/images/ai-visibility-mentions.png?w=1100\u0026fit=max\u0026auto=format\u0026n=3L0jUS0Gnf-g9E7B\u0026q=85\u0026s=45c16d4ca22439b92953a2d70fb6c91c 1100w, https://mintcdn.com/trackbase/3L0jUS0Gnf-g9E7B/images/ai-visibility-mentions.png?w=1650\u0026fit=max\u0026auto=format\u0026n=3L0jUS0Gnf-g9E7B\u0026q=85\u0026s=2a1df71ab4afdc1dc65e9d4531af5940 1650w, https://mintcdn.com/trackbase/3L0jUS0Gnf-g9E7B/images/ai-visibility-mentions.png?w=2500\u0026fit=max\u0026auto=format\u0026n=3L0jUS0Gnf-g9E7B\u0026q=85\u0026s=6096872d39488e7e9adedd2ed334444b 2500w`}),`\n`,_jsx(Heading,{level:`2`,id:`the-six-tabs`,children:`The six tabs`}),`\n`,_jsxs(Table,{children:[_jsx(_components.thead,{children:_jsxs(_components.tr,{children:[_jsx(_components.th,{children:`Tab`}),_jsx(_components.th,{children:`What it shows`}),_jsx(_components.th,{children:`Read more`})]})}),_jsxs(_components.tbody,{children:[_jsxs(_components.tr,{children:[_jsx(_components.td,{children:_jsx(_components.strong,{children:`Mentions`})}),_jsx(_components.td,{children:`Every AI answer that mentions your brand, with total mentions, average position, mention rate and average sentiment. Filter by model, sentiment or answers with citations.`}),_jsx(_components.td,{children:_jsx(_components.a,{href:`/mentions-and-citations`,children:`Mentions and citations`})})]}),_jsxs(_components.tr,{children:[_jsx(_components.td,{children:_jsx(_components.strong,{children:`Sentiment`})}),_jsx(_components.td,{children:`How AI answers frame your brand over time: the daily split between positive, neutral and negative, your current sentiment score out of 100, and the sentiment around citations.`}),_jsx(_components.td,{children:_jsx(_components.a,{href:`/sentiment-score`,children:`Sentiment`})})]}),_jsxs(_components.tr,{children:[_jsx(_components.td,{children:_jsx(_components.strong,{children:`Fan-outs`})}),_jsx(_components.td,{children:`The searches AI models ran while answering your prompts.`}),_jsx(_components.td,{children:_jsx(_components.a,{href:`/fan-outs`,children:`Fan-out queries`})})]}),_jsxs(_components.tr,{children:[_jsx(_components.td,{children:_jsx(_components.strong,{children:`Sources`})}),_jsx(_components.td,{children:`The URLs and domains AI models cite, with the number of unique URLs, unique domains and the average number of sources per answer. Switch between a URL, domain and prompt view.`}),_jsx(_components.td,{children:_jsx(_components.a,{href:`/mentions-and-citations`,children:`Mentions and citations`})})]}),_jsxs(_components.tr,{children:[_jsx(_components.td,{children:_jsx(_components.strong,{children:`Competitors`})}),_jsx(_components.td,{children:`The competitors you track, the ones Trackbase suggests and the ones you ignore.`}),_jsx(_components.td,{children:_jsx(_components.a,{href:`/competitors`,children:`Competitors`})})]}),_jsxs(_components.tr,{children:[_jsx(_components.td,{children:_jsx(_components.strong,{children:`Heatmap`})}),_jsx(_components.td,{children:`The visibility of your brand and every competitor, per AI model.`}),_jsx(_components.td,{children:`See below`})]})]})]}),`\n`,_jsx(Heading,{level:`2`,id:`filters`,children:`Filters`}),`\n`,_jsxs(_components.ul,{children:[`\n`,_jsxs(_components.li,{children:[_jsx(_components.strong,{children:`Period`}),`: choose 7, 30 or 90 days, or set a custom range, at the top right.`]}),`\n`,_jsxs(_components.li,{children:[_jsx(_components.strong,{children:`Model`}),`: on the Mentions and Sources tabs you can limit the page to one model.`]}),`\n`]}),`\n`,_jsx(Heading,{level:`2`,id:`the-heatmap`,children:`The heatmap`}),`\n`,_jsxs(_components.p,{children:[`The `,_jsx(_components.strong,{children:`Heatmap`}),` tab puts brands in rows and AI models in columns. Each cell shows a brand’s visibility on that model, and a darker cell means a higher score.`]}),`\n`,_jsx(_components.p,{children:`Use it to answer two questions at once:`}),`\n`,_jsxs(_components.ul,{children:[`\n`,_jsxs(_components.li,{children:[_jsx(_components.strong,{children:`Where am I weak?`}),` Read your own row. A pale cell is a model that rarely mentions you.`]}),`\n`,_jsxs(_components.li,{children:[_jsx(_components.strong,{children:`Who is strong there?`}),` Read that column. The darkest cell shows which competitor that model prefers.`]}),`\n`]}),`\n`,_jsxs(_components.p,{children:[`Switch between `,_jsx(_components.strong,{children:`All`}),` and `,_jsx(_components.strong,{children:`Tracked`}),` to include or leave out suggested competitors.`]}),`\n`,_jsx(Tip,{children:`A good overall score can hide one model where you are nearly absent. Check the heatmap before you conclude that things are fine.`})]})}function MDXContent(props={}){const{wrapper:MDXLayout}={..._provideComponents(),...props.components};return MDXLayout?_jsx(MDXLayout,{...props,children:_jsx(_createMdxContent,{...props})}):_createMdxContent(props)}return{default:MDXContent};function _missingMdxReference(id,component){throw new Error(`Expected `+(component?`component`:`object`)+\" `\"+id+\"` to be defined: you likely forgot to import, pass, or provide it.\")}","frontmatter":{},"scope":{"config":{},"pageMetadata":{"title":"The AI Visibility page and its six tabs","sidebarTitle":"AI Visibility page","description":"The AI Visibility page shows how your brand appears in AI answers, in six tabs: Mentions, Sentiment, Fan-outs, Sources, Competitors and Heatmap.","keywords":["AI Visibility","mentions","sources","heatmap","sentiment"],"href":"/ai-visibility"}}},"mdxSourceWithNoJs":null},"mdxExtracts":{"tableOfContents":[{"title":"The six tabs","slug":"the-six-tabs","depth":2,"children":[]},{"title":"Filters","slug":"filters","depth":2,"children":[]},{"title":"The heatmap","slug":"the-heatmap","depth":2,"children":[]}],"codeExamples":{}},"jsLinks":[],"subdomain":"trackbase","siteName":"Trackbase Academy","title":"The AI Visibility page and its six tabs - Trackbase Academy","navMaps":{"firstHrefInVersion":{},"firstHrefInLanguage":{}},"lastModified":"2026-11-12T13:50:35.925Z","gitLastModified":"2026-11-12T13:50:26.000Z","originalFileLocation":"ai-visibility.mdx"},"headHtml":"\u003cscript data-mint-head>(function(){var d=document.documentElement,p=null;if(!p){try{p=localStorage.getItem(\"isDarkMode\")}catch(e){}if(p==='true')p='dark';else if(p==='false')p='light';if(p!=='light'\u0026\u0026p!=='dark'\u0026\u0026p!=='system')p=\"system\"}var r=p==='system'?(matchMedia(\"(prefers-color-scheme: dark)\").matches?'dark':'light'):p;d.classList.remove(r==='dark'?'light':'dark');d.classList.add(r);d.setAttribute(\"data-theme-preference\",p)})();\u003c/script>\u003cmeta data-mint-head name=\"description\" content=\"The AI Visibility page shows how your brand appears in AI answers, in six tabs: Mentions, Sentiment, Fan-outs, Sources, Competitors and Heatmap.\">\u003cmeta data-mint-head name=\"application-name\" content=\"Trackbase Academy\">\u003cmeta data-mint-head name=\"generator\" content=\"Mintlify\">\u003clink data-mint-head rel=\"icon\" type=\"image/png\" sizes=\"192x192\" href=\"/mintlify-assets/_mintlify/favicons/trackbase/cZVZpDJGfe2ZjpqW/_generated/favicon/android-chrome-192x192.png\" media=\"(prefers-color-scheme: light)\">\u003clink data-mint-head rel=\"apple-touch-icon\" type=\"image/png\" sizes=\"180x180\" href=\"/mintlify-assets/_mintlify/favicons/trackbase/cZVZpDJGfe2ZjpqW/_generated/favicon/apple-touch-icon.png\">\u003clink data-mint-head rel=\"icon\" type=\"image/png\" sizes=\"16x16\" href=\"/mintlify-assets/_mintlify/favicons/trackbase/cZVZpDJGfe2ZjpqW/_generated/favicon/favicon-16x16.png\" media=\"(prefers-color-scheme: light)\">\u003clink data-mint-head rel=\"icon\" type=\"image/png\" sizes=\"32x32\" href=\"/mintlify-assets/_mintlify/favicons/trackbase/cZVZpDJGfe2ZjpqW/_generated/favicon/favicon-32x32.png\" media=\"(prefers-color-scheme: light)\">\u003clink data-mint-head rel=\"shortcut icon\" type=\"image/x-icon\" href=\"/mintlify-assets/_mintlify/favicons/trackbase/cZVZpDJGfe2ZjpqW/_generated/favicon/favicon.ico\" media=\"(prefers-color-scheme: light)\">\u003clink data-mint-head rel=\"icon\" type=\"image/png\" sizes=\"192x192\" href=\"/mintlify-assets/_mintlify/favicons/trackbase/cZVZpDJGfe2ZjpqW/_generated/favicon-dark/android-chrome-192x192.png\" media=\"(prefers-color-scheme: dark)\">\u003clink data-mint-head rel=\"icon\" type=\"image/png\" sizes=\"16x16\" href=\"/mintlify-assets/_mintlify/favicons/trackbase/cZVZpDJGfe2ZjpqW/_generated/favicon-dark/favicon-16x16.png\" media=\"(prefers-color-scheme: dark)\">\u003clink data-mint-head rel=\"icon\" type=\"image/png\" sizes=\"32x32\" href=\"/mintlify-assets/_mintlify/favicons/trackbase/cZVZpDJGfe2ZjpqW/_generated/favicon-dark/favicon-32x32.png\" media=\"(prefers-color-scheme: dark)\">\u003clink data-mint-head rel=\"shortcut icon\" type=\"image/x-icon\" href=\"/mintlify-assets/_mintlify/favicons/trackbase/cZVZpDJGfe2ZjpqW/_generated/favicon-dark/favicon.ico\" media=\"(prefers-color-scheme: dark)\">\u003cmeta data-mint-head property=\"og:title\" content=\"The AI Visibility page and its six tabs - Trackbase Academy\">\u003cmeta data-mint-head property=\"og:description\" content=\"The AI Visibility page shows how your brand appears in AI answers, in six tabs: Mentions, Sentiment, Fan-outs, Sources, Competitors and Heatmap.\">\u003cmeta data-mint-head property=\"og:site_name\" content=\"Trackbase Academy\">\u003cmeta data-mint-head property=\"og:url\" content=\"https://academy.trackbase.ai/ai-visibility\">\u003cmeta data-mint-head property=\"og:type\" content=\"website\">\u003cmeta data-mint-head property=\"og:image\" content=\"https://trackbase.mintlify.site/_mintlify/api/og/v2?division=AI+visibility\u0026amp;title=The+AI+Visibility+page+and+its+six+tabs\u0026amp;description=The+AI+Visibility+page+shows+how+your+brand+appears+in+AI+answers%2C+in+six+tabs%3A+Mentions%2C+Sentiment%2C+Fan-outs%2C+Sources%2C+Competitors+and+Heatmap.\u0026amp;theme=64376a44aeb2e399501d0854\u0026amp;signature=cea378a6ce738422e12cb198a0c3ac00a63fae49ff0aa206691befacfb0994ec\">\u003cmeta data-mint-head property=\"og:image:width\" content=\"1200\">\u003cmeta data-mint-head property=\"og:image:height\" content=\"630\">\u003cmeta data-mint-head name=\"twitter:card\" content=\"summary_large_image\">\u003cmeta data-mint-head name=\"twitter:title\" content=\"The AI Visibility page and its six tabs - Trackbase Academy\">\u003cmeta data-mint-head name=\"twitter:description\" content=\"The AI Visibility page shows how your brand appears in AI answers, in six tabs: Mentions, Sentiment, Fan-outs, Sources, Competitors and Heatmap.\">\u003cmeta data-mint-head name=\"twitter:image\" content=\"https://trackbase.mintlify.site/_mintlify/api/og/v2?division=AI+visibility\u0026amp;title=The+AI+Visibility+page+and+its+six+tabs\u0026amp;description=The+AI+Visibility+page+shows+how+your+brand+appears+in+AI+answers%2C+in+six+tabs%3A+Mentions%2C+Sentiment%2C+Fan-outs%2C+Sources%2C+Competitors+and+Heatmap.\u0026amp;theme=64376a44aeb2e399501d0854\u0026amp;signature=cea378a6ce738422e12cb198a0c3ac00a63fae49ff0aa206691befacfb0994ec\">\u003cmeta data-mint-head name=\"twitter:image:width\" content=\"1200\">\u003cmeta data-mint-head name=\"twitter:image:height\" content=\"630\">\u003cmeta data-mint-head name=\"msapplication-config\" content=\"/mintlify-assets/_mintlify/favicons/trackbase/cZVZpDJGfe2ZjpqW/_generated/favicon/browserconfig.xml\">\u003cmeta data-mint-head name=\"apple-mobile-web-app-title\" content=\"Trackbase Academy\">\u003cmeta data-mint-head name=\"msapplication-TileColor\" content=\"#1866E1\">\u003clink data-mint-head rel=\"canonical\" href=\"https://academy.trackbase.ai/ai-visibility\">\u003clink data-mint-head rel=\"alternate\" type=\"application/xml\" href=\"/sitemap.xml\">\u003clink data-mint-head rel=\"alternate\" type=\"text/markdown\" href=\"/ai-visibility.md\">\u003cscript data-mint-head type=\"application/ld+json\">{\"@context\":\"https://schema.org\",\"@graph\":[{\"@type\":\"Organization\",\"@id\":\"https://academy.trackbase.ai/#organization\",\"name\":\"Trackbase Academy\",\"url\":\"https://academy.trackbase.ai\",\"logo\":{\"@type\":\"ImageObject\",\"url\":\"https://mintcdn.com/trackbase/Yn-1fgKFjXMFFVKa/logo/light.svg?fit=max\u0026auto=format\u0026n=Yn-1fgKFjXMFFVKa\u0026q=85\u0026s=2bcd74b61e3e1b5d984edaca4b4073a5\"}},{\"@type\":\"WebSite\",\"@id\":\"https://academy.trackbase.ai#website\",\"name\":\"Trackbase Academy\",\"url\":\"https://academy.trackbase.ai\",\"publisher\":{\"@id\":\"https://academy.trackbase.ai/#organization\"}},{\"@type\":\"WebPage\",\"@id\":\"https://academy.trackbase.ai/ai-visibility#webpage\",\"url\":\"https://academy.trackbase.ai/ai-visibility\",\"name\":\"The AI Visibility page and its six tabs\",\"description\":\"The AI Visibility page shows how your brand appears in AI answers, in six tabs: Mentions, Sentiment, Fan-outs, Sources, Competitors and Heatmap.\",\"dateModified\":\"2026-11-12T13:50:26.000Z\",\"isPartOf\":{\"@id\":\"https://academy.trackbase.ai#website\"},\"breadcrumb\":{\"@id\":\"https://academy.trackbase.ai/ai-visibility#breadcrumb\"}},{\"@type\":\"BreadcrumbList\",\"@id\":\"https://academy.trackbase.ai/ai-visibility#breadcrumb\",\"itemListElement\":[{\"@type\":\"ListItem\",\"position\":1,\"name\":\"Trackbase Academy\",\"item\":\"https://academy.trackbase.ai\"},{\"@type\":\"ListItem\",\"position\":2,\"name\":\"The AI Visibility page and its six tabs\",\"item\":\"https://academy.trackbase.ai/ai-visibility\"}]},{\"@type\":[\"Article\",\"TechArticle\"],\"@id\":\"https://academy.trackbase.ai/ai-visibility#article\",\"headline\":\"The AI Visibility page and its six tabs\",\"name\":\"The AI Visibility page and its six tabs\",\"description\":\"The AI Visibility page shows how your brand appears in AI answers, in six tabs: Mentions, Sentiment, Fan-outs, Sources, Competitors and Heatmap.\",\"url\":\"https://academy.trackbase.ai/ai-visibility\",\"mainEntityOfPage\":{\"@id\":\"https://academy.trackbase.ai/ai-visibility#webpage\"},\"dateModified\":\"2026-11-12T13:50:26.000Z\",\"keywords\":\"AI Visibility, mentions, sources, heatmap, sentiment\",\"publisher\":{\"@id\":\"https://academy.trackbase.ai/#organization\"},\"isPartOf\":{\"@id\":\"https://academy.trackbase.ai#website\"}}]}\u003c/script>\u003cscript data-mint-head type=\"application/ld+json\">{\"@context\":\"https://schema.org\",\"@type\":\"WebSite\",\"name\":\"Trackbase Academy\",\"publisher\":{\"@type\":\"Organization\",\"name\":\"Trackbase Academy\"},\"provider\":{\"@type\":\"Organization\",\"name\":\"Mintlify\",\"url\":\"https://mintlify.com\"}}\u003c/script>","agentPointerHref":"/ai-visibility.md","siteName":"Trackbase Academy","nav":{"global":null,"groups":[{"group":"Getting started","icon":"rocket","pages":[{"title":"Trackbase Academy","sidebarTitle":"Overview","href":"/index"},{"title":"Welcome to Trackbase","href":"/welcome-to-trackbase"},{"title":"Quickstart","href":"/quickstart"},{"title":"Product map: what every menu item does","sidebarTitle":"Product map","href":"/product-map"},{"title":"Glossary","href":"/glossary"}]},{"group":"Core metrics","icon":"chart-line","pages":[{"title":"Metrics overview","href":"/metrics-overview"},{"title":"How the visibility score is calculated","sidebarTitle":"Visibility score","href":"/visibility-score"},{"title":"Share of voice: your part of the conversation","sidebarTitle":"Share of voice","href":"/share-of-voice"},{"title":"Presence rate and average position","sidebarTitle":"Presence and position","href":"/presence-and-position"},{"title":"Sentiment: how AI describes your brand","sidebarTitle":"Sentiment","href":"/sentiment-score"},{"title":"Mentions and citations: what is the difference?","sidebarTitle":"Mentions and citations","href":"/mentions-and-citations"}]},{"group":"Set up","icon":"settings","pages":[{"title":"Set up your brand profile and aliases","sidebarTitle":"Brand profile","href":"/brand-profile"},{"title":"Track and manage your competitors","sidebarTitle":"Competitors","href":"/competitors"},{"title":"Add the prompts you want to track","sidebarTitle":"Adding prompts","href":"/adding-prompts"},{"title":"Choose which AI models to track","sidebarTitle":"Choosing models","href":"/choosing-models"},{"title":"Manage your team, roles and plan","sidebarTitle":"Team and billing","description":"Invite colleagues to your Trackbase workspace, give each the right role, and manage your plan and invoices from the settings.","href":"/team-and-billing"}]},{"group":"AI visibility","icon":"eye","pages":[{"title":"The AI Visibility page and its six tabs","sidebarTitle":"AI Visibility page","href":"/ai-visibility"},{"title":"Fan-out queries: what AI models search for","sidebarTitle":"Fan-out queries","description":"Fan-out queries are the searches an AI model runs while it writes an answer. Trackbase records them so you know which terms to cover.","href":"/fan-outs"},{"title":"Track your products in ChatGPT Shopping","sidebarTitle":"Shopping","href":"/shopping"},{"title":"Follow your ChatGPT Ads campaigns in Trackbase","sidebarTitle":"ChatGPT Ads","href":"/chatgpt-ads"}]},{"group":"Take action","icon":"list-checks","pages":[{"title":"Work through your recommendations with Actions","sidebarTitle":"Actions","href":"/actions"},{"title":"Write articles for your content gaps with Content","sidebarTitle":"Content","href":"/content"},{"title":"Set your writing style, rules and WordPress connection","sidebarTitle":"Style, rules and WordPress","href":"/content-style-and-rules"},{"title":"Follow individual pages with the Page tracker","sidebarTitle":"Page tracker","href":"/page-tracker"}]},{"group":"Crawlers and traffic","icon":"bot","pages":[{"title":"See which AI crawlers read your website","sidebarTitle":"Crawler analytics","href":"/crawler-analytics"},{"title":"Install the Trackbase Analytics WordPress plugin","sidebarTitle":"WordPress plugin","href":"/wordpress-plugin"},{"title":"Connect Cloudflare for crawler analytics","sidebarTitle":"Cloudflare","href":"/cloudflare"},{"title":"Measure visits from AI with visitor analytics","sidebarTitle":"Visitor analytics","href":"/visitor-analytics"}]},{"group":"Integrations","icon":"plug","pages":[{"title":"Connect Trackbase to Claude and other AI tools","sidebarTitle":"MCP server","href":"/mcp-server"}]},{"group":"Troubleshooting","icon":"wrench","pages":[{"title":"Why did my score drop?","href":"/why-did-my-score-drop"},{"title":"Why is my visibility zero?","href":"/visibility-zero"},{"title":"How fresh is my data?","sidebarTitle":"Data freshness","href":"/data-freshness"}]}]},"basePath":"","title":"The AI Visibility page and its six tabs - Trackbase Academy","buildId":"dpl_DqYu5MPb49gWBBbUGgpHQUmCHY3P","deploymentId":"dpl_DqYu5MPb49gWBBbUGgpHQUmCHY3P","dynamics":["a74be98ba7"],"chunks":["zoom-image-lightbox-DTFzvaXJ.js","lightbox-handle-r17bVUz3.js"]}